Liquidity Flows For NT8
See where hidden liquidity trades in volume.
It is much less stressful to trade in the direction that the liquidity is trading!
Liquidity Flows...Created By A Trader For Traders

Michael Valtos
Hi, I am Michael Valtos, and those of you who know me, know I am an authority on order flow trading. I have written books and given seminars on order flow all over the world. I have been trading order flow for decades. I have even created my own software for trading order flow based on my own trading. I have spent nearly 20 years trading on the institutional side of the market. I traded for JP Morgan (8 years). I traded for Cargill (4years). I traded for Commerzbank (3 years). I traded for EDF Man (2 years). I started my career on the CME Floor with Dean Witter in 1994.
One of the most important parts of trading I learned early was the importance of seeing and understanding what the big traders are doing in the market. As trading against them can lead to a trader to the poor house. We have all heard the saying "If you can't beat them, join them." This is especially true in trading.
One of the most important parts of trading I learned early was the importance of seeing and understanding what the big traders are doing in the market. As trading against them can lead to a trader to the poor house. We have all heard the saying "If you can't beat them, join them." This is especially true in trading.
The Importance of Liquidity
Do you know why liquidity is important? Simply put it shows you where traders are willing to get involved. But simply knowing where traders want to get involved is one part of the market equation, when traders are getting involved is what really matters. Once traders are engaged in the market, meaning they have put a position on, that shows their commitment to the market.
Traded Liquidity Is What Matters
Orders are constantly both being placed and cancelled in the order book that are never traded. While at the same time there are orders that are being traded and sometimes for good size. What do you think is more important for the movement in the market? A big order being entered away from the market or a big order coming to the market and trading? It's the big order being traded because that is the actual support or resistance being formed in the market.
Resting Liquidity
The market depth traders understand the importance of resting liquidity in the market. It is often there to absorb either the aggressive buying or aggressive selling taking place in the market. But it is obvious. Everyone who looks at Level 2 data can see it. Knowing when resting liquidity is real (doesn't get easily pulled or moved) and actually trades is important. But there is other, more important lquidity to track and analyze.
Hidden Bids and Hidden Offers - What's That?
Speaking from experience, when a big trader has size to trade they don't always want to show it to the market. There is a tendency to hide size on orders over 50 contracts because the algos will pick up the big order and jump in front of it resulting in a worse fill. When big institutional traders want to get in right now, they will iceberg their orders more often than not. So if they have say, 800 contracts to buy, they don't show all 800 at once, they iceberg it, meaning they enter the whole 800 contracts, but only show a small amount like 40 contracts at a time and the iceberg will refresh until the whole 800 contract order is filled. Hidden Bids and Hidden Offers are when big traders want to get filled but hide their size. This can be done either aggressively, at the market, or passively, by working bids or offers.
Liquidity Flows
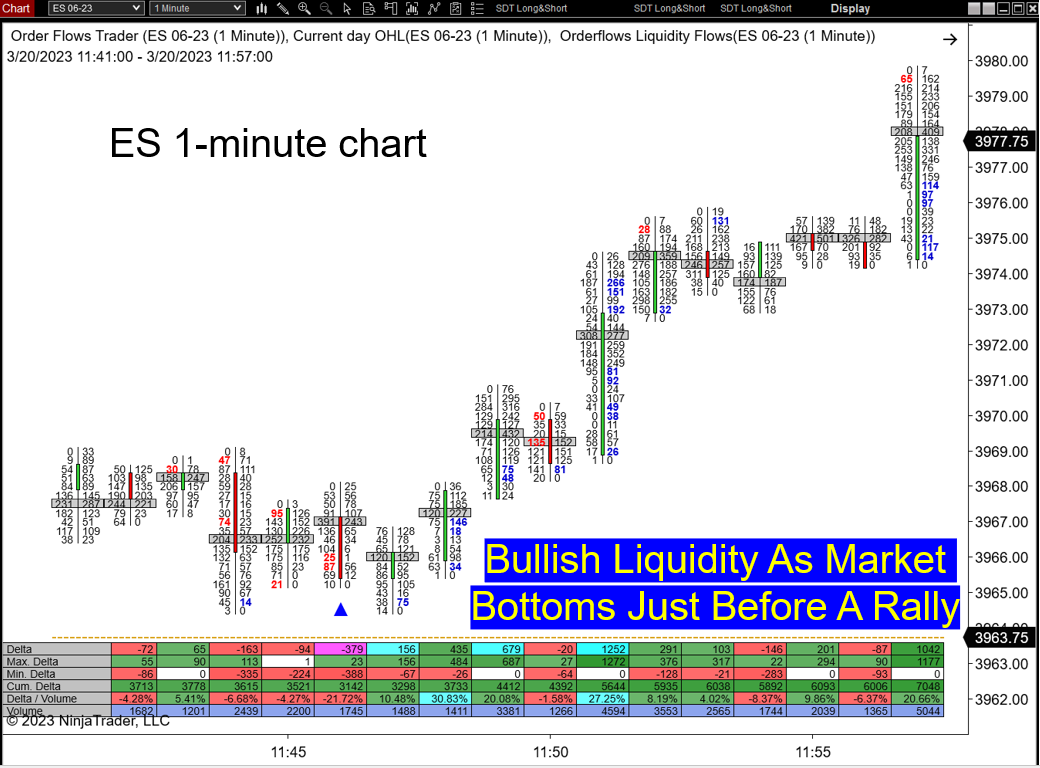
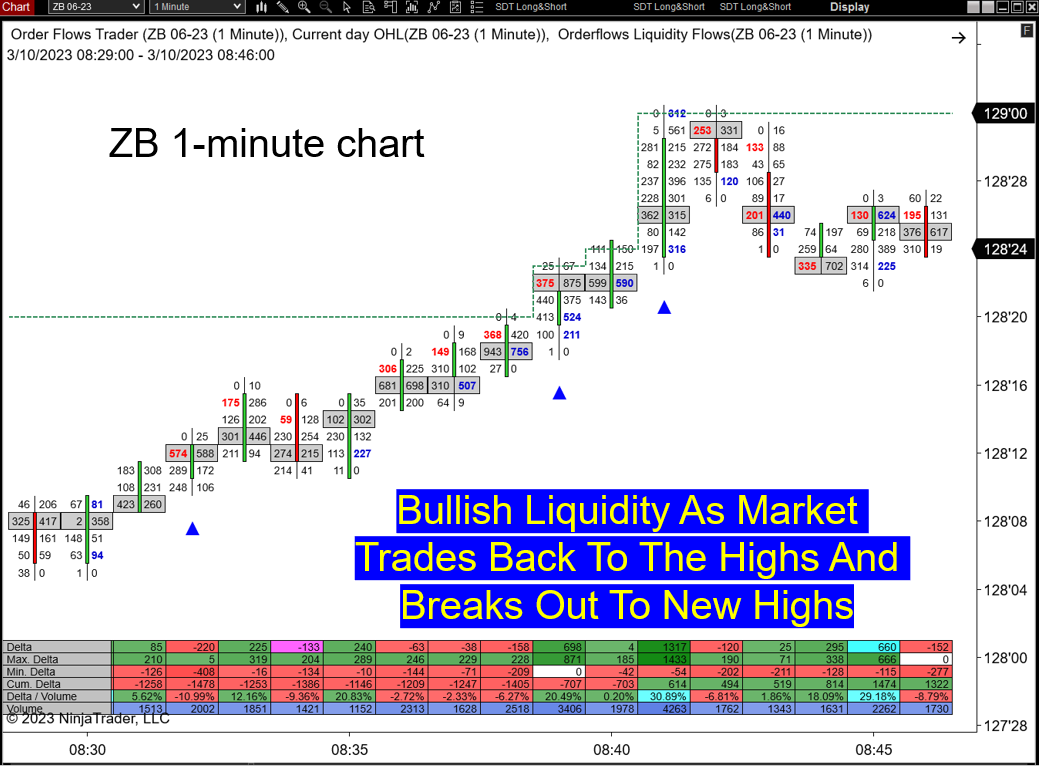
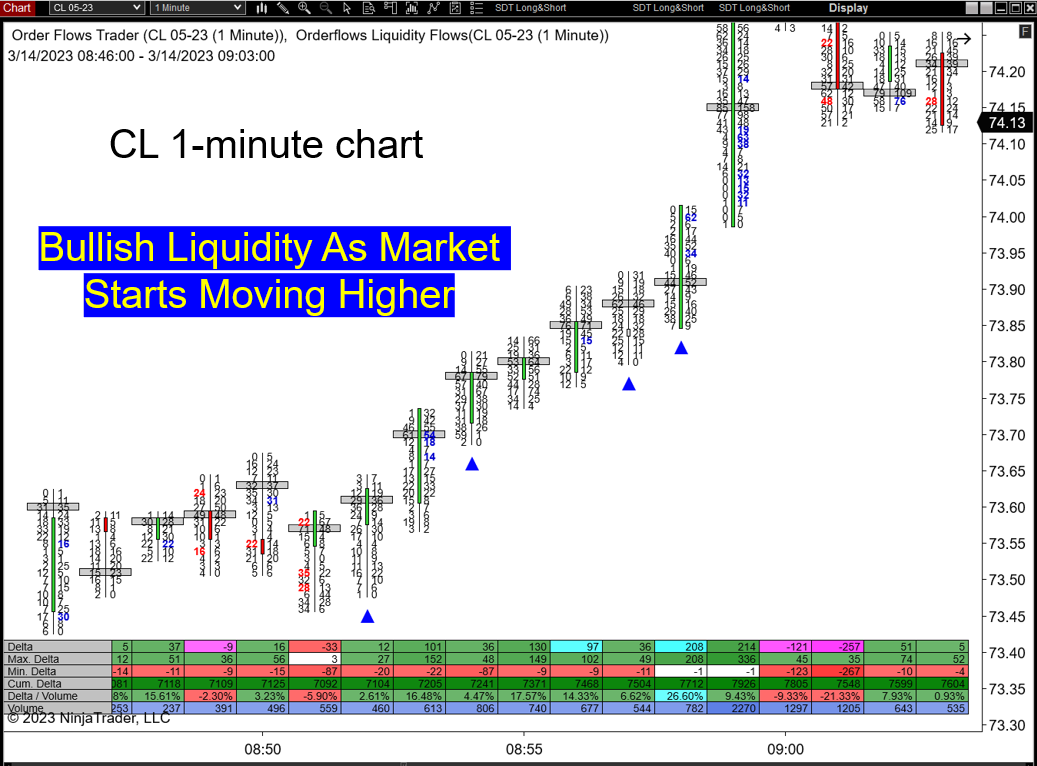
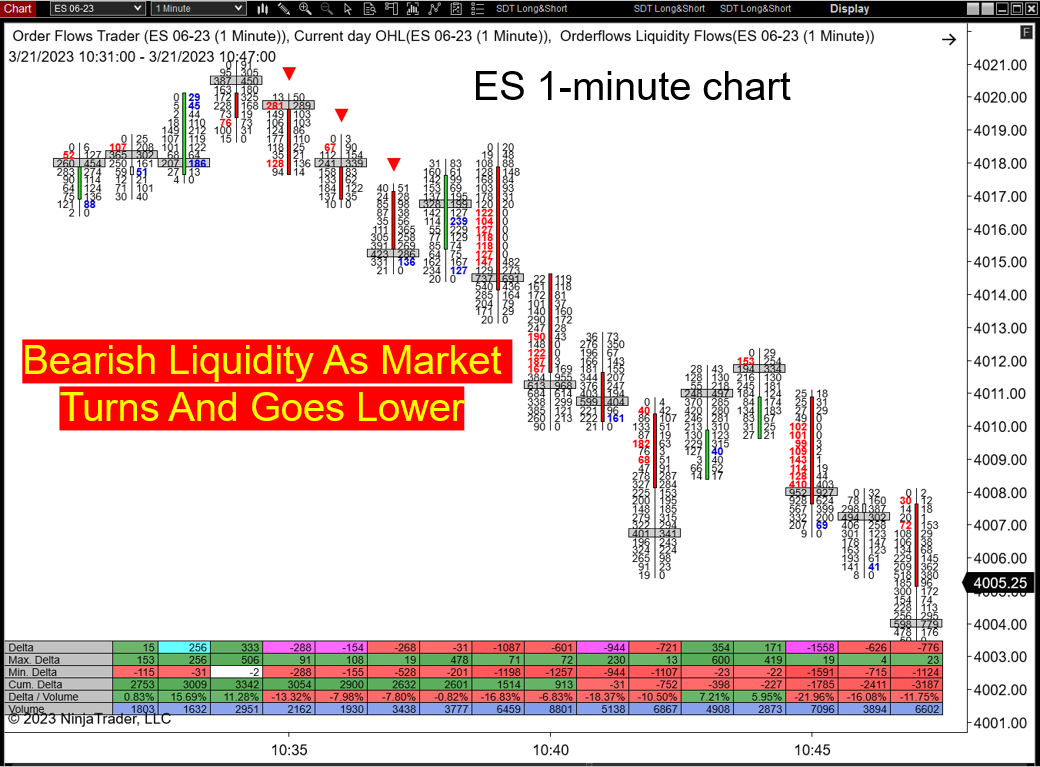
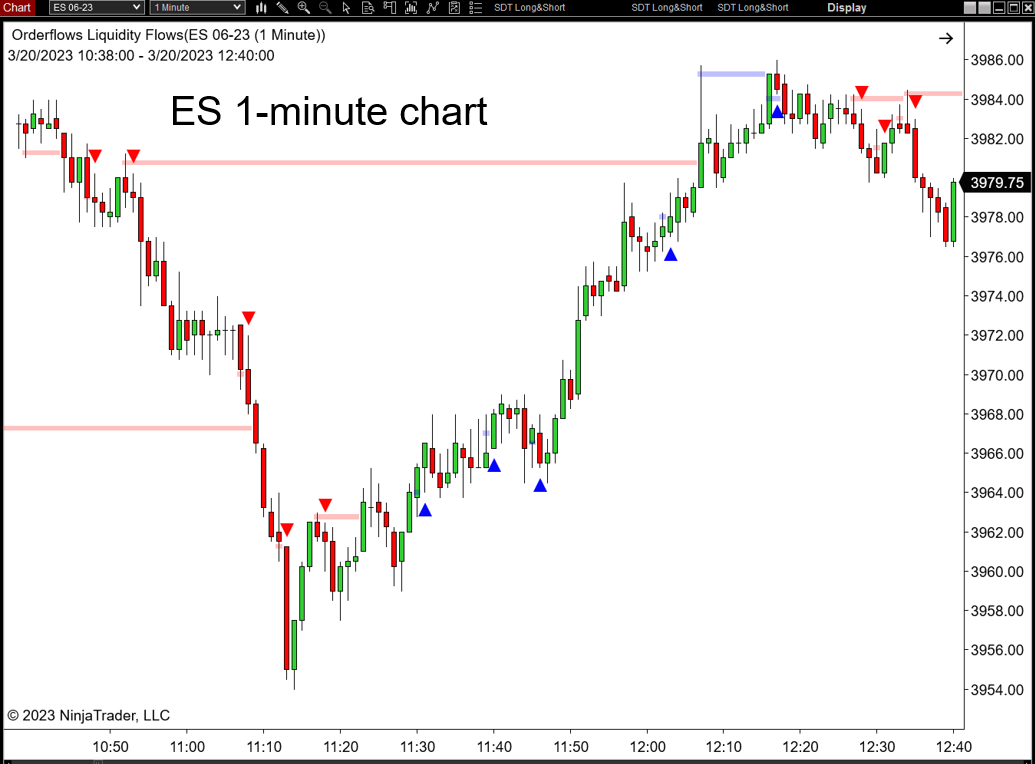
The Liquidity Flows indicator looks specifically for those areas where there is the hidden liquidity trading. By analyzing the traded order flow we are now able to take advantage of seeing where the big traders are active in the market and more importantly which direction they are trading in. Now you can see those areas on your regular candlestick or bar chart, without needing a market depth map or a footprint chart.
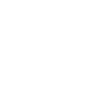
Trying To Read A DOM Is A Struggle
While a DOM (Price Ladder - Depth of Market) is useful in some circumstances. The reality of trying to trade off a DOM for most traders is that it just moves too fast nowadays. 8-10 years ago, it was manageable to sit and watch, but nowadays for the uninitiated, it is extremely difficult.
A market drawback is that you can't really tell if a big trader has canceled their hidden size or is trading it. Without this information, traders will fail to understand why the market is moving the way it is.
A market drawback is that you can't really tell if a big trader has canceled their hidden size or is trading it. Without this information, traders will fail to understand why the market is moving the way it is.
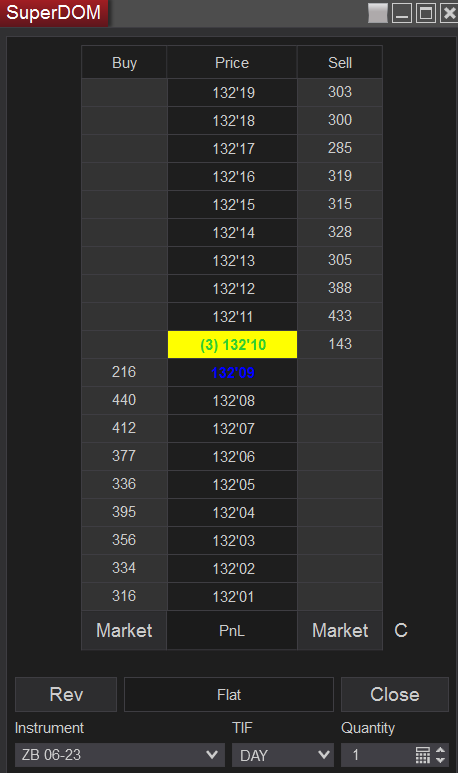
Reading a market depth map is confusing to many traders
While a market depth map has information about liquidity, we still need to dissect it to determine how much volume actually traded and whether that volume is significant or just normal trading taking place.
Constantly watching bids and offers being placed but never trading only has limited value to most traders. Or even seeing resting liquidity at almost every level has little value to most traders. You also have to monitor what trades and how it trades.
Constantly watching bids and offers being placed but never trading only has limited value to most traders. Or even seeing resting liquidity at almost every level has little value to most traders. You also have to monitor what trades and how it trades.
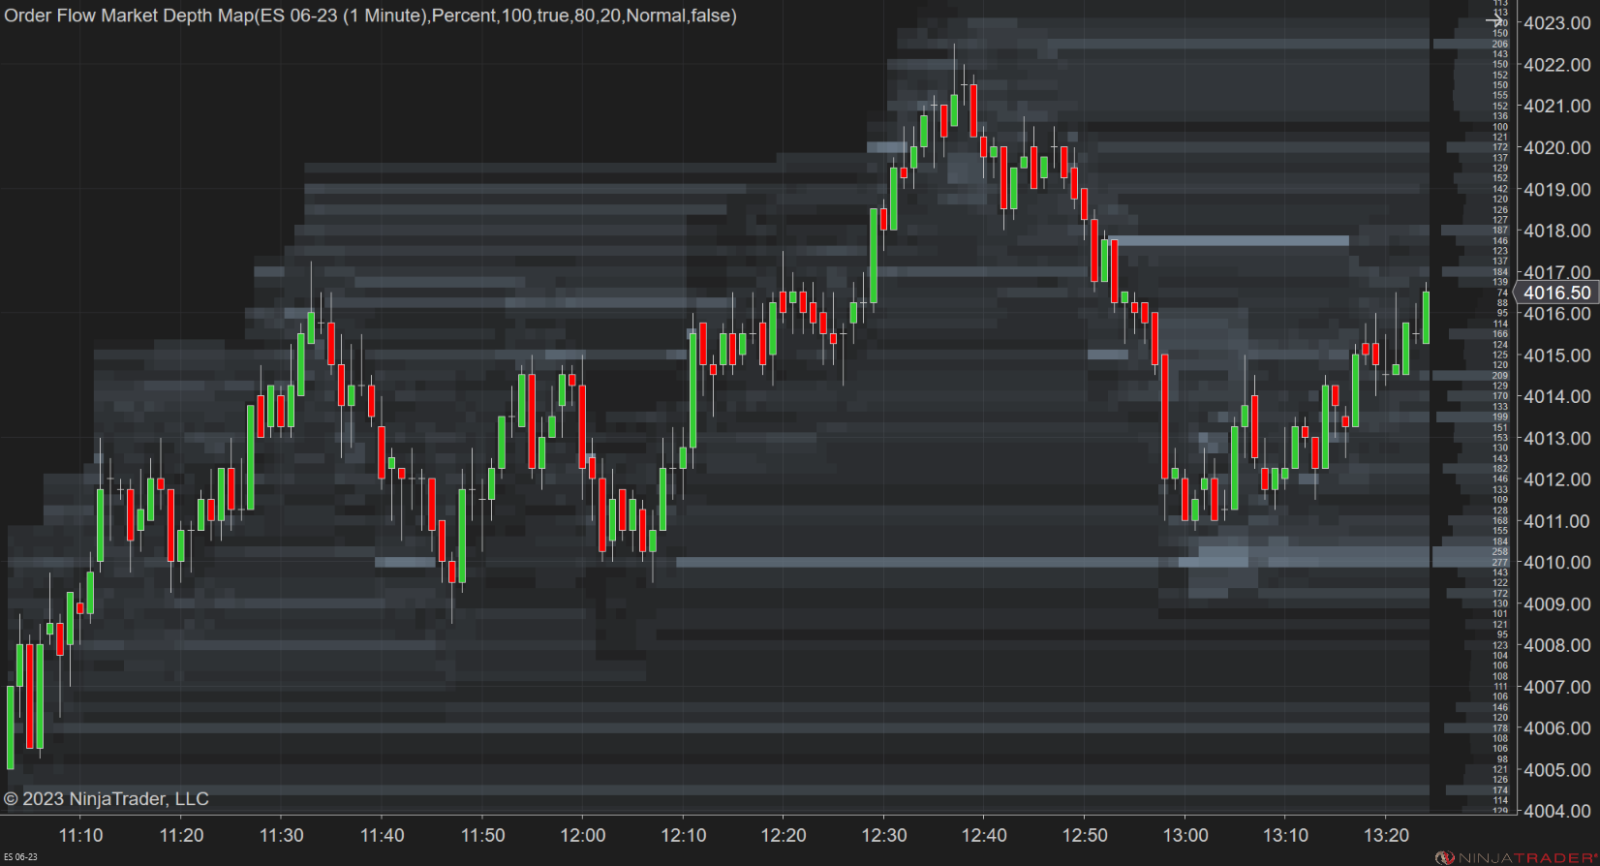
The Order Flow Footprint Chart Provides A Lot Of Information...If You Know Exactly What To Look For...
The main benefit of using an order flow footprint chart is that it gives information about the volume being traded on the bid and the volume being traded on the offer. From this volume information, a trader can see when the market is moving out of balance or is trading in balance. This is information that is not available in either the DOM, Market Depth Map, or Price Charts.
When it comes to resting liquidity away from the current bid/offer, it can't be seen on a footprint chart. A footprint chart simply analyzes the volume traded and how it traded. But from that information, you can determine when there is liquidity coming into the current bid/offer.
Once you are able to determine when liquidity is coming into the market, the next step is to determine if it is heavy liquidity that would come from big traders and more importantly is actually trading in the market. That is the important liquidity - when big traders are providing liquidity and other traders are taking the liquidity.
This is what the Liquidity Flows indicator looks for.
Let's Get To The Charts
Don't Want To Look At Order Flow Charts?
No Problem - Use Your Existing Charts!
No Problem - Use Your Existing Charts!
Harness the power of order flow without needing to monitor every trade that goes through!
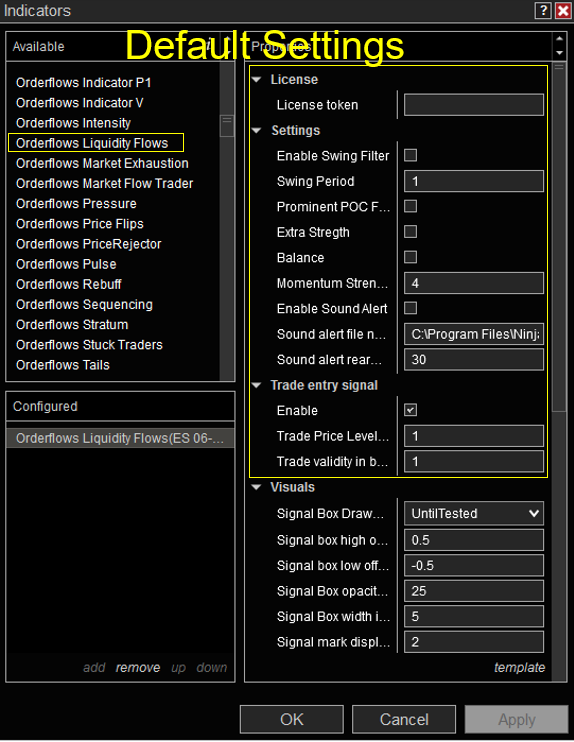
A problem with a lot of indicators is you often have to curve fit it for your market. In other words, you have to find the best settings that worked in the past and hope they work in the future. That is a recipe for disaster.
Here are the default settings used:
Here are the default settings used:
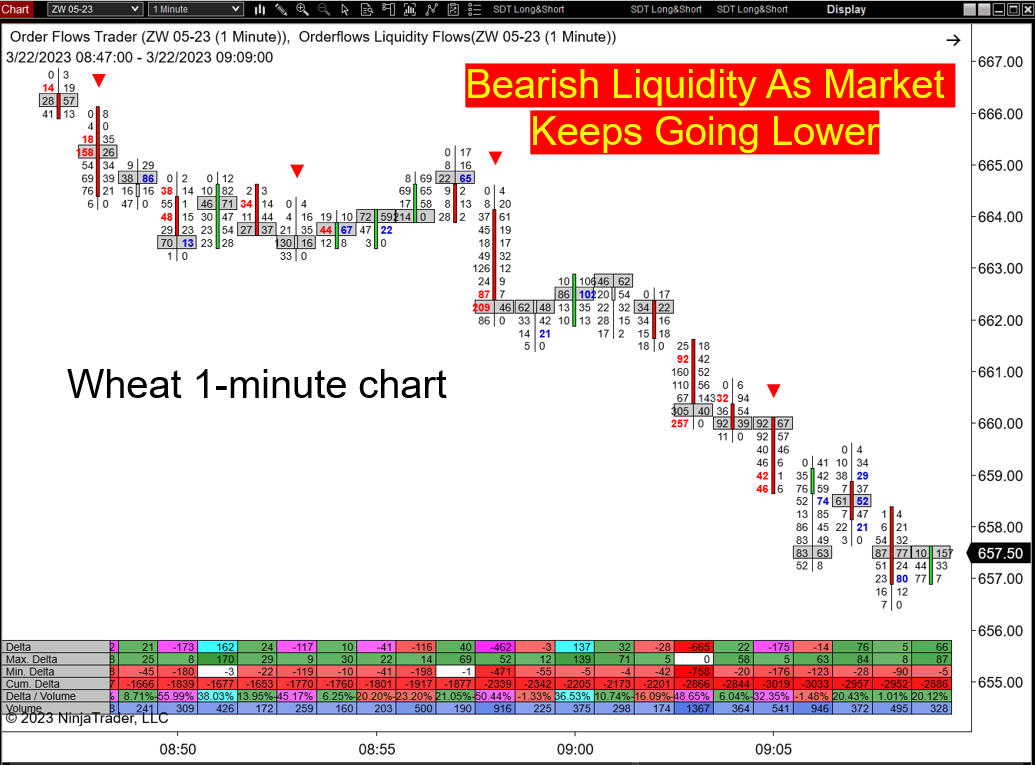
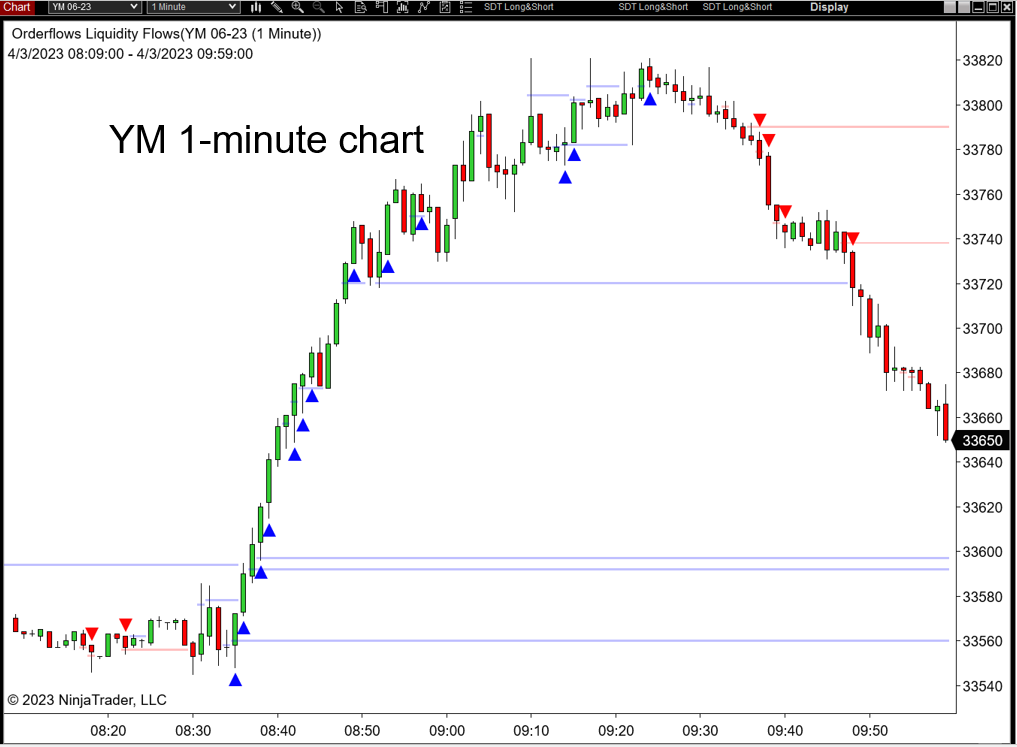
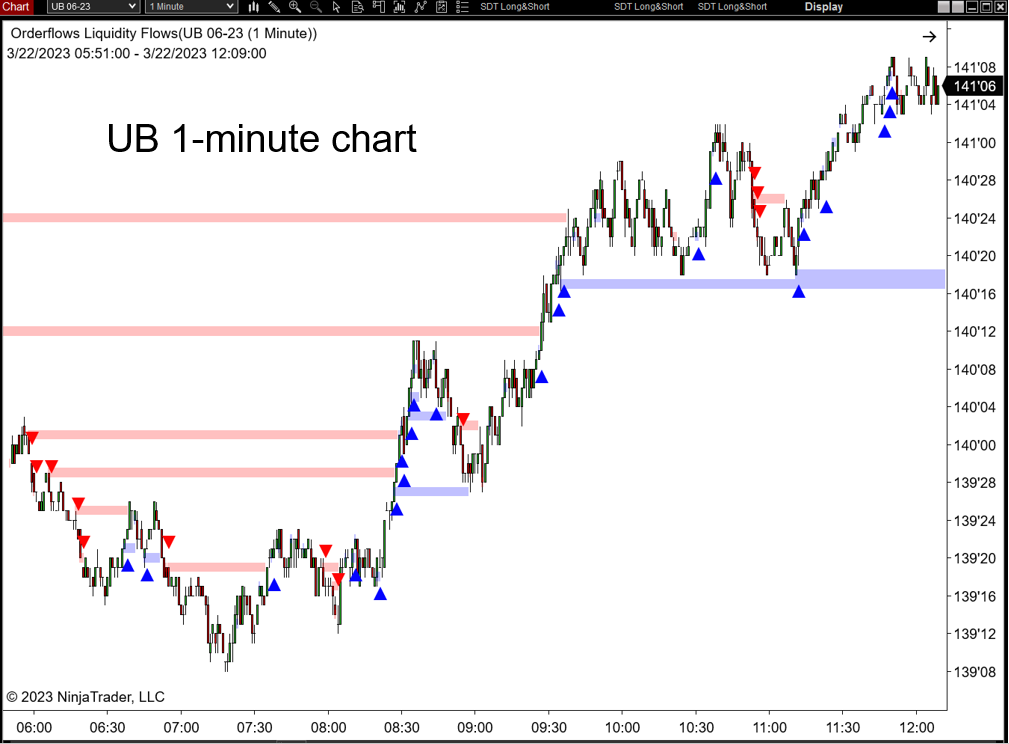
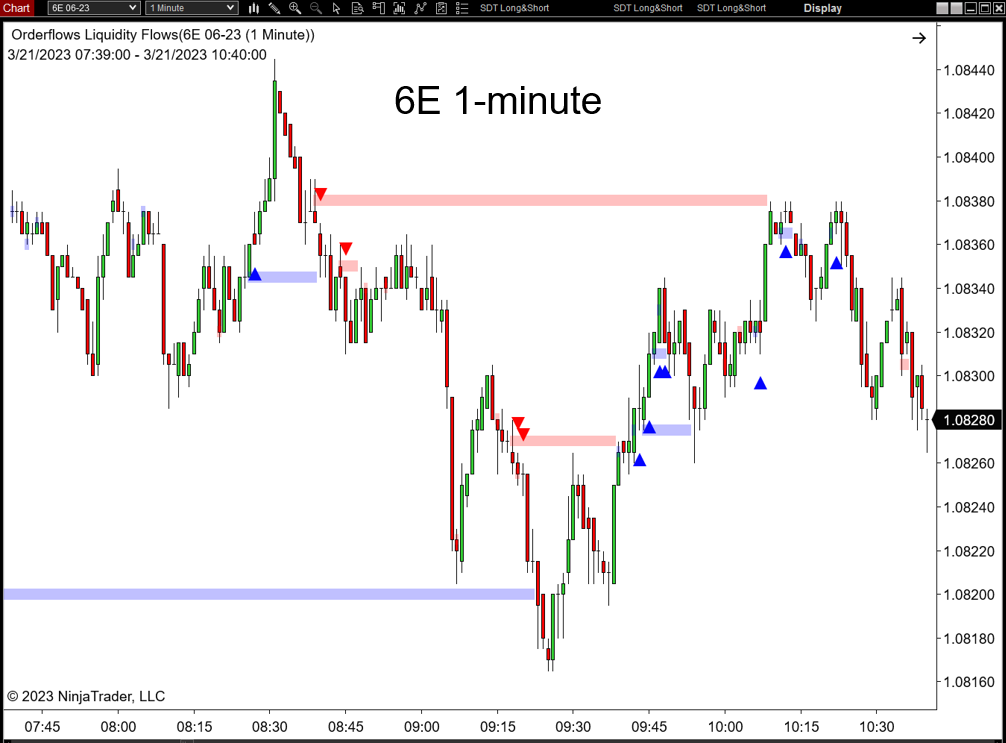
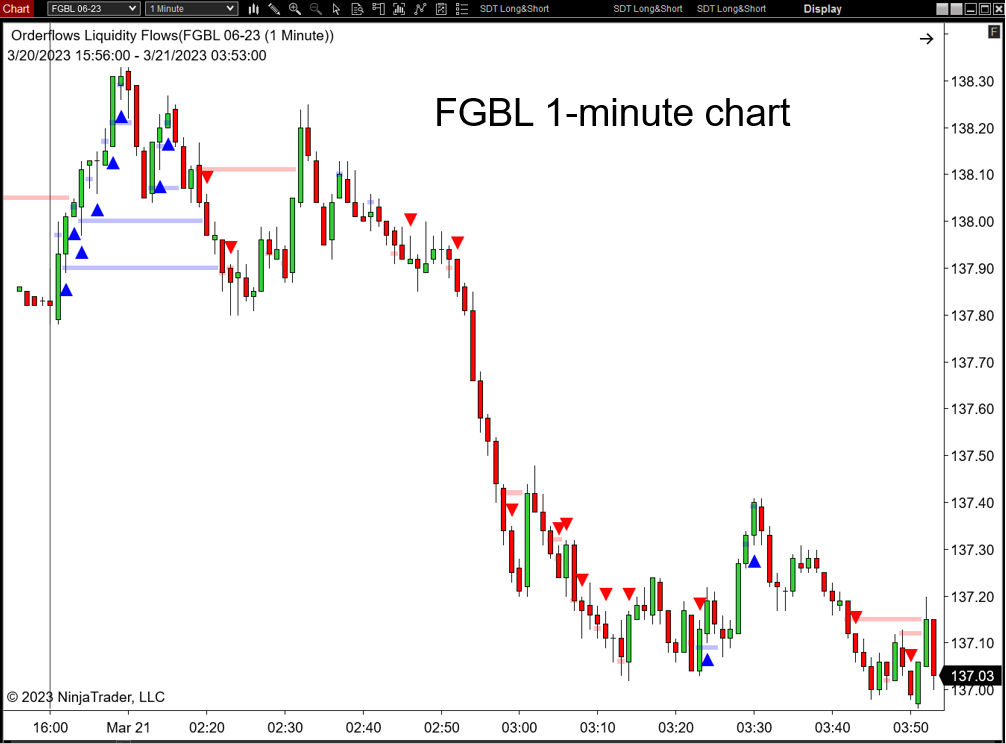
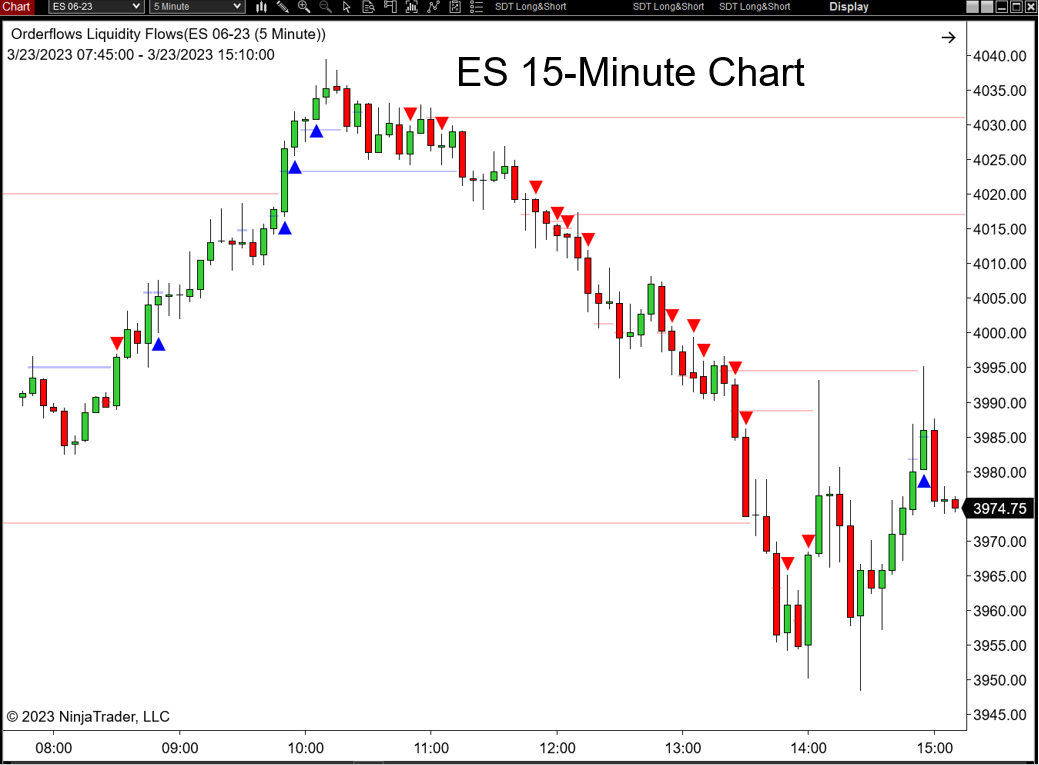
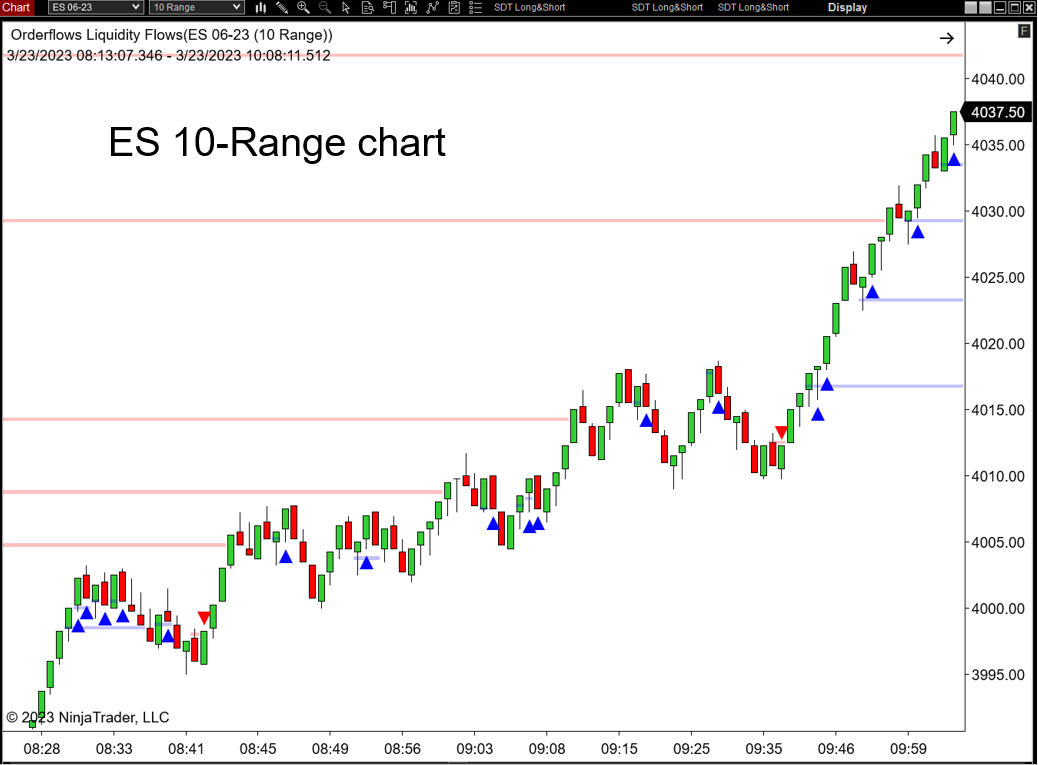
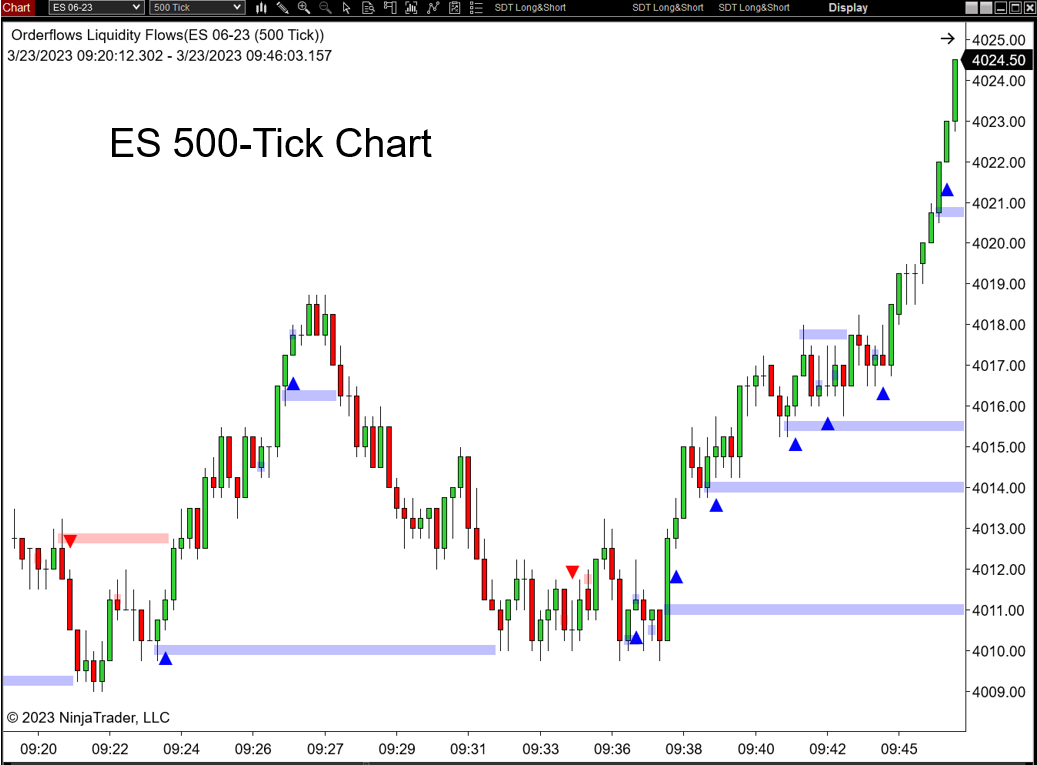
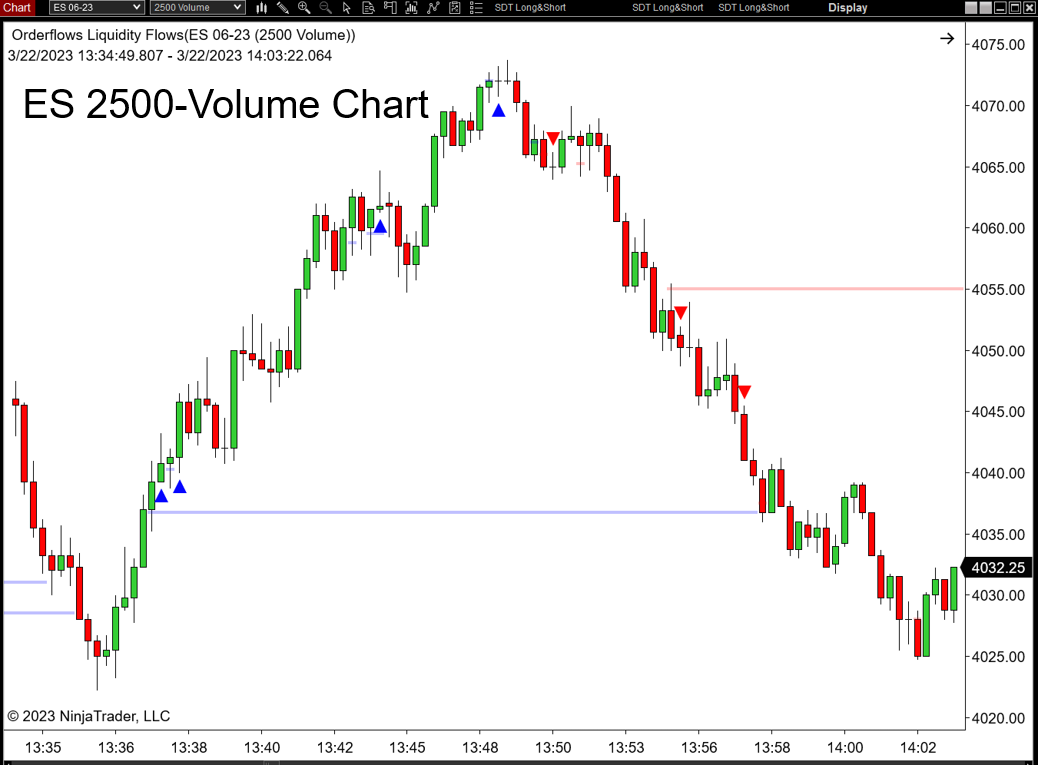
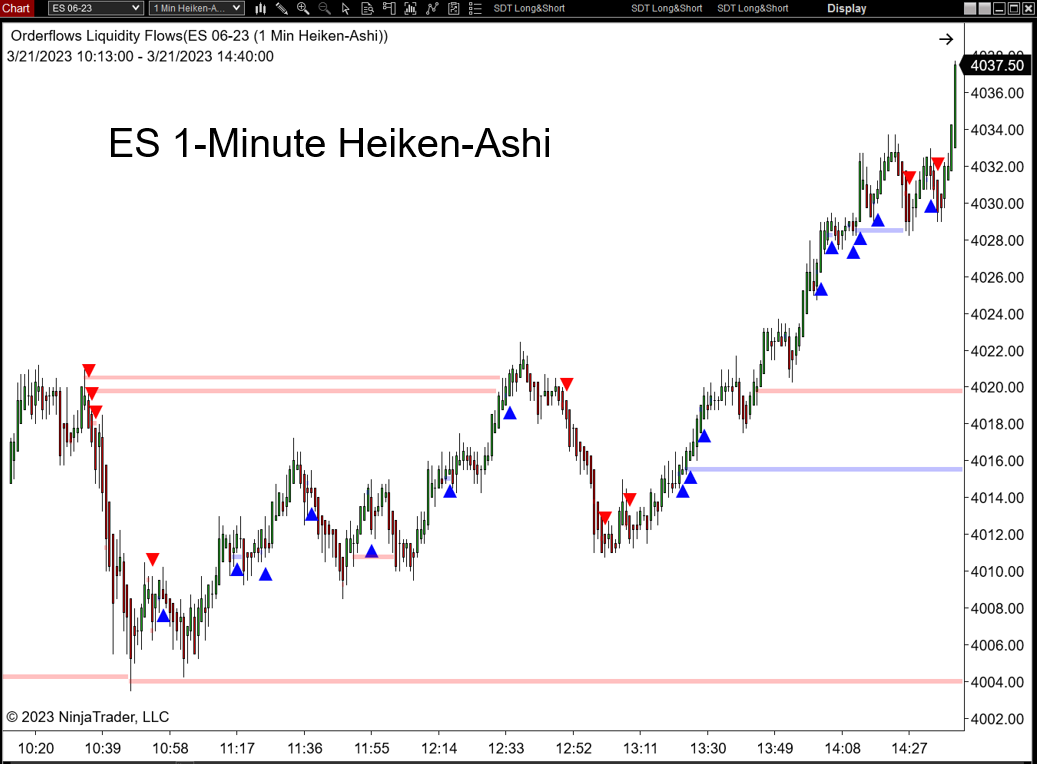
For any method of market analysis to be legitimate it should be able to be applied to other markets or the same market but on different chart types with the same settings. Here is the ES with five different markets with THE EXACT DEFAULT SAME settings of liquidity Flows.
Get Liquidity Flows for NinjaTrader 8 (NT8)
Now For Just $399
Now For Just $399
Once your payment has been processed, the Liquidity Flows indicator will be sent to the email address you used to complete your PayPal transaction. All emails are usually sent within 3-6 hours. Usually much sooner.
Frequently Asked Questions and Answers:
Q. What trading platform does the Liquidity Flows run on?
A. Liquidity Flows runs on the desktop version of NinjaTrader 8, both the free and paid version.
Q. Do I need the Orderflows Trader software to run Liquidity Flows?
A. No. Liquidity Flows is a stand-alone indicator that interprets the order flow liquidity and price action in the market.
Q. Is Liquidity Flows a footprint chart and does one come with it?
A. No, Liquidity Flows analyzes the data from the order flow so you do not need a footprint chart or a market depth chart.
Q. Do I need Level 2 data to run Liquidity Flows?
A. No, Liquidity Flows will run on normal Level 1 data, but you will need to enable the Tick Replay feature on NinjaTrader 8 to show the signals on a historical chart.
Q. I am a short term trader, I look at the DOM and tick charts. Will Liquidity Flows help me?
A. Yes. Liquidity Flows analyzes volume traded on the bid and volume on the offer. I prefer to run Liquidity Flows on charts ranging from 30-seconds to 1-minute to 15-minutes and range charts between 4 range and 10 range as well as tick and volume based charts.
Q. Do I need to use a footprint chart to use Liquidity Flows?
A. No. Liquidity Flows will run on any chart type. It will run on regular bar charts, candlesticks charts. Just about any chart you use, it can be run on.
Q. When I load Liquidity Flows on my chart I don't see any arrows?
A. Liquidity Flows reads the traded bid volume and the traded offer volume. To see it on historical data, you will need to enable tick replay. If you do not use tick replay, it will start analyzing the real-time data coming in. With tick replay enabled, Liquidity Flows will analyze the historical data on your chart when you load it on your chart.
Q. Do I need tick replay to run Liquidity Flows?
A. Yes, if you want to analyze historical data then tick replay needs to be enabled.
Q. How many PCs can I run Liquidity Flows on?
A. One PC per license. To run on additional PCs would require additional licenses.
Q. Do you offer a free trial?
A. Unfortunately no.
What are you waiting for?
Click the button here to get started --->
Copyright 2023 | Liquidityflows.com | All rights reserved
Disclaimer and Risk Disclosure:
CFTC Rules 4.41: Hypothetical or Simulated performance results have certain limitations, unlike an actual performance record, simulated results do not represent actual trading. Also, since the trades have not been executed, the results may have under-or-over compensated for the impact, if any, of certain market factors, such as lack of liquidity. Simulated trading programs in general are also subject to the fact that they are designed with the benefit of hindsight. No representation is being made that any account will or is likely to achieve profit or losses similar to those shown.
Disclaimer:
This presentation is for educational and informational purposes only and should not be considered a solicitation to buy or sell a futures contract or make any other type of investment decision. Futures trading contains substantial risk and is not for every investor. An investor could potentially lose all or more than the initial investment. Risk capital is money that can be lost without jeopardizing ones financial security or life style. Only risk capital should be used for trading and only those with sufficient risk capital should consider trading. Past performance is not necessarily indicative of future results.
Risk Disclosure:
Futures and forex trading contains substantial risk and is not for every investor. An investor could potentially lose all or more than the initial investment. Risk capital is money that can be lost without jeopardizing ones’ financial security or life style. Only risk capital should be used for trading and only those with sufficient risk capital should consider trading. Past performance is not necessarily indicative of future results.
Hypothetical Performance Disclosure:
Hypothetical performance results have many inherent limitations, some of which are described below. no representation is being made that any account will or is likely to achieve profits or losses similar to those shown; in fact, there are frequently sharp differences between hypothetical performance results and the actual results subsequently achieved by any particular trading program. One of the limitations of hypothetical performance results is that they are generally prepared with the benefit of hindsight. In addition, hypothetical trading does not involve financial risk, and no hypothetical trading record can completely account for the impact of financial risk of actual trading. for example, the ability to withstand losses or to adhere to a particular trading program in spite of trading losses are material points which can also adversely affect actual trading results. There are numerous other factors related to the markets in general or to the implementation of any specific trading program which cannot be fully accounted for in the preparation of hypothetical performance results and all which can adversely affect trading results.
Thanks for subscribing. Share your unique referral link to get points to win prizes..
Loading..